Official result from Brazil's Superior Electoral Court (TSE) and IPSE's projection of the final result, nationwide and in each state. The page updates itself every 60 seconds. The projection is statistical; the official result is the TSE's.
BALLOT BOXES COUNTED IN BRAZIL–
Loading TSE data…
The count from start to finish
Lula and Flávio in valid votes, from the first ballot boxes on: what the TSE counted, IPSE's projection of the final result, and the expected path of the count to 100%.
Lula counted (TSE)Flávio counted (TSE)Expected path of the count to 100%IPSE projection of the final result, with 95% rangeIPSE final study for Lula: 49.9% (80% range: 47.8–52.0)
Runoff map
Choose the scale (municipalities or states) and the indicator. Hover over (or tap) to see the numbers; click a municipality to open its profile, or a state to open its count.
Ballot boxes and valid votes counted in each region, with IPSE's projection of the final result.
By state
Result in each state. The border color shows who won.
Where the runoff votes came from
Who voted for whom, from the first round to the runoff. Hover over the bands to see how many voters took each path. The diagram and the waterfalls follow the state chosen in the selector below.
For each candidate: first-round votes, what he lost, what he gained and from whom, up to the runoff total. In millions of votes; for Brazil, the 90% margin in parentheses.
Lula
Flávio
Todos os cargos
Presidente, governador, senado e deputados, no 1º turno, e o 2º turno de presidente e de governador, por estado, município e bairro.
Forecasts and polls against the count
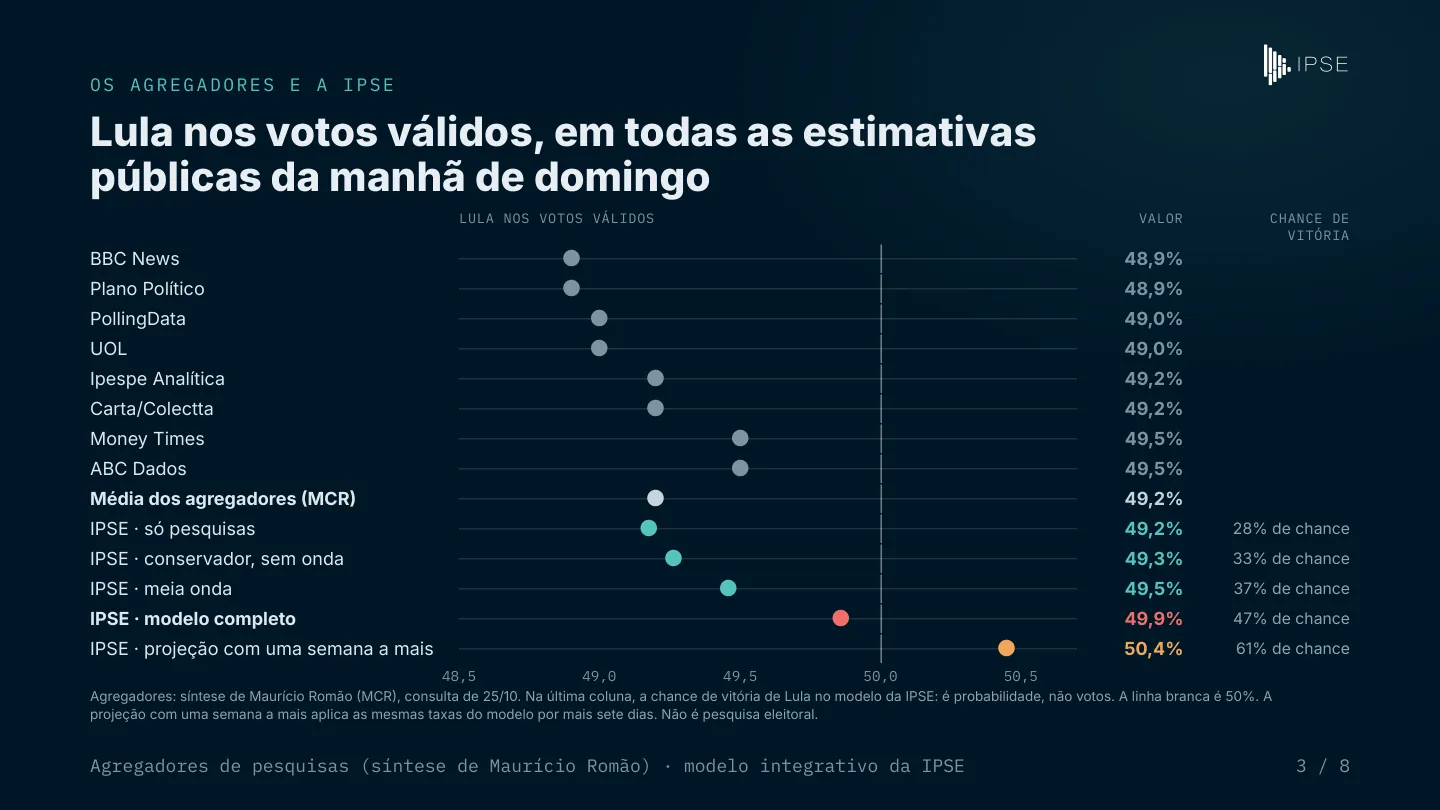
What pollsters measured in the final week, what aggregators and IPSE forecast before the vote, and where the projection stands, for Lula (red) and Flávio (blue), in valid votes. The vertical lines are IPSE's projection with the count; once counting ends, they are the result. The “dif.” column shows how far each estimate was above or below the projection for Lula (Flávio's is the same with the opposite sign).
O modelo da IPSE diante do resultado
A conta, passo a passo
As probabilidades comparadas
What IPSE published before the vote
The final predictive study (Oct 24) and the election-morning addendum (Oct 25, 8 am), in Portuguese, at ipse.global/publications. The count is the test of the model, and the comparison will be made in public.
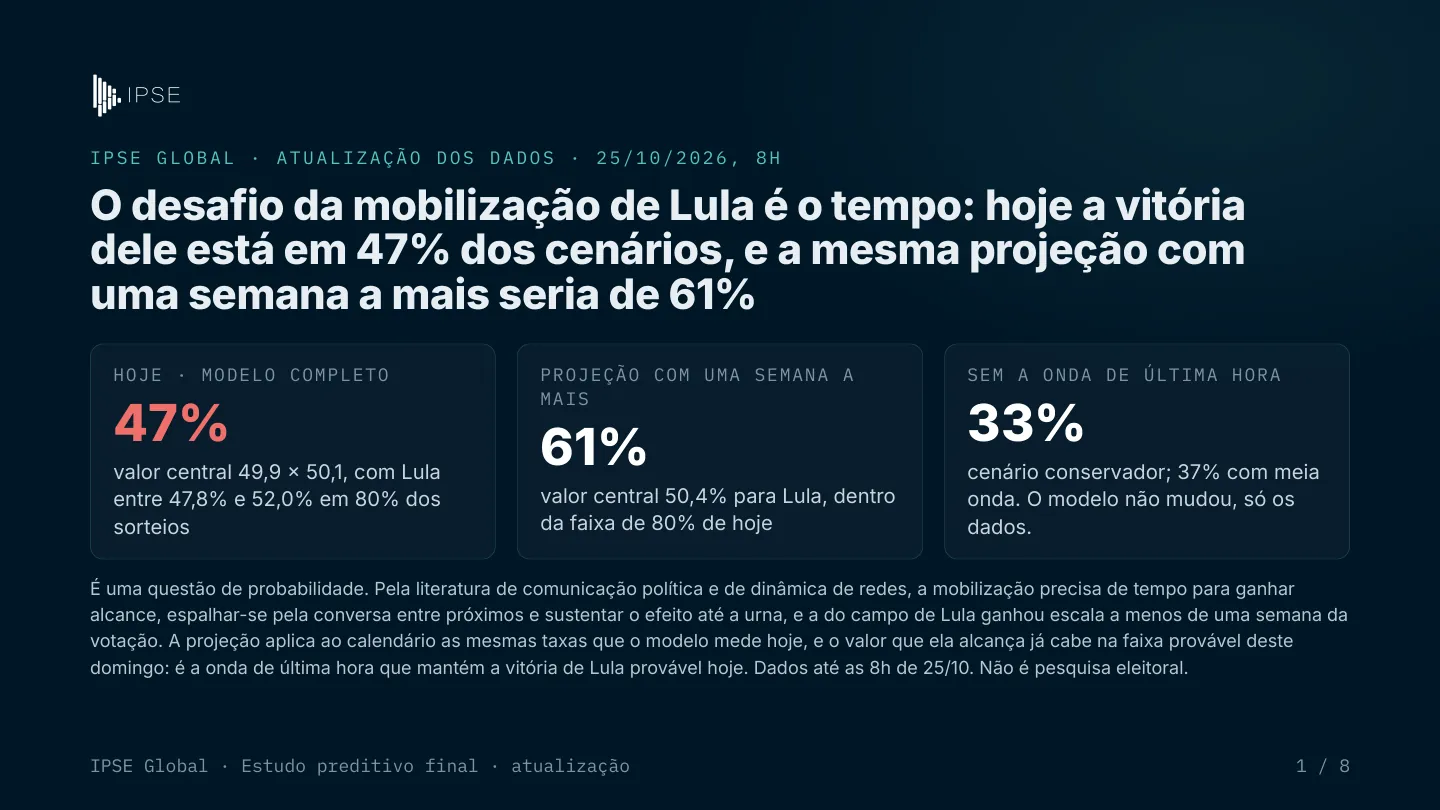
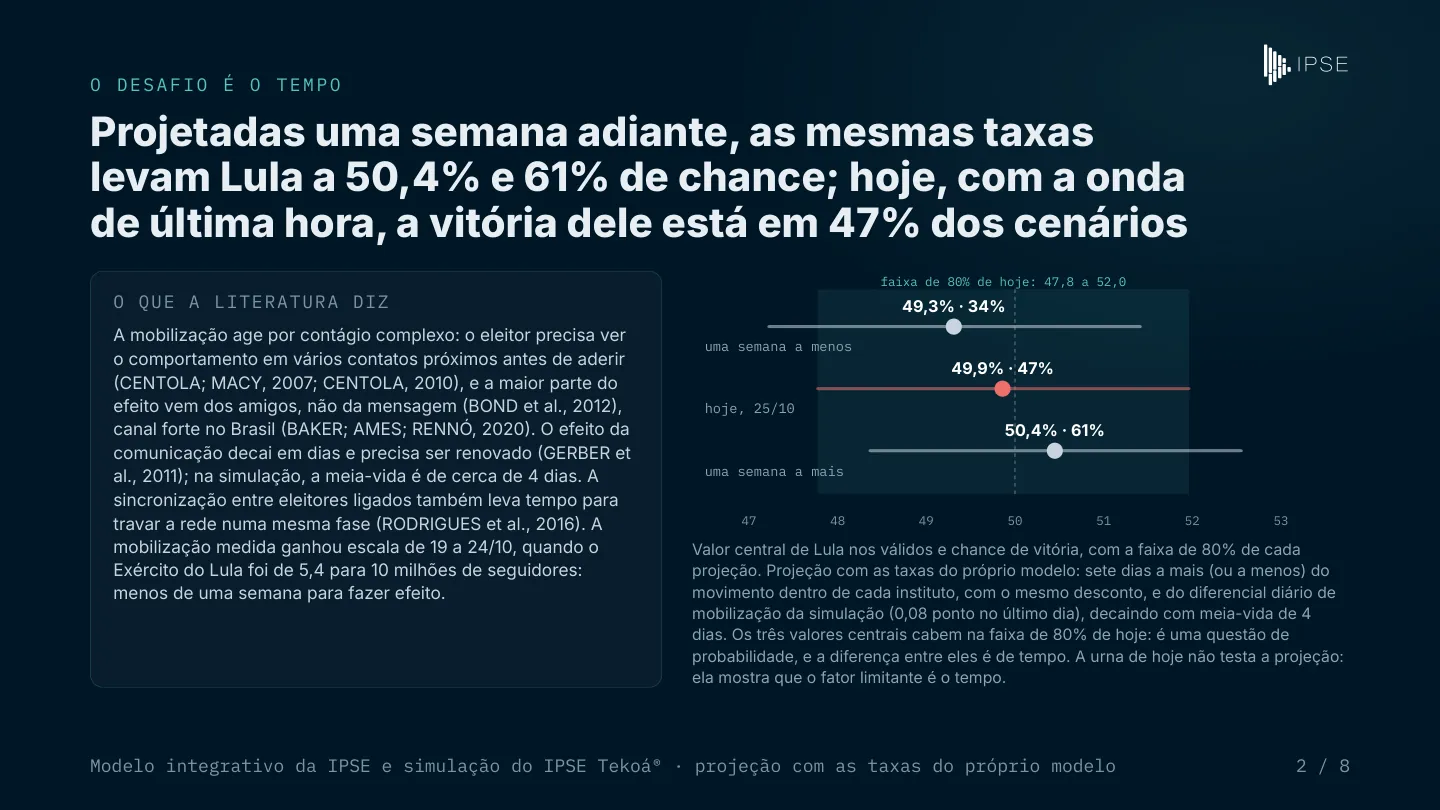
Oct 25 addendum, 8 am: 47% of scenarios that day; 61% with one more week.The aggregators and IPSE, with the chance of winning in its own column.The challenge is time: the projections against the model's 80% range.
During the count, every minute, we read from the TSE the votes for Lula and Flávio in each state and abroad, and how many sections of each municipality had been counted. The baseline is the 2026 first round, summed section by section from the TSE's open data (499,000 sections), and the 2022 runoff. The start of the series, from 5:07 pm to 8:06 pm, when this panel went live, reproduces the minute-by-minute record of the TSE count published on Estadão's projection panel.
2
Projecting the result
For each municipality we know how Lula and Flávio did in the first round. In the 150 largest cities, about 40% of the electorate, we measured every minute the city's own change between rounds, on a logistic scale, and applied it to what was still to be counted there. Elsewhere we used the change measured in the rest of the state, and a state with almost nothing counted used the national change. The number of votes still to come follows each place's electorate, adjusted by the turnout already observed. Late-counting regions therefore enter the projection with the vote they showed in the first round, not with the average of what had been counted so far.
3
Uncertainty and the chance of winning
Uncertainty comes from three sources, all about what is still to be counted: (1) the error in the change estimated for each state, measured by the actual spread of changes across large cities tonight (– point); (2) the order of sections within each large city, which does not count centre and periphery at the same time (2 points on the remaining share of each); and (3) an error common to the whole country, from the uneven redistribution of the roughly 8% of votes for other first-round candidates (1 point). Together they give the deviation σ. The 95% range is the projection ± 1.96σ, and the chance of winning is Φ((projection − 50) / σ). Tested on the 2022 runoff with simulated counting orders, the method erred by less than 0.15 point.
4
How the projection performed
At 8:06 pm, with 27% of boxes counted and Lula still behind in the count (49.5%), the projection gave him 51.4%, with a 95% range of 50.1% to 52.7% that already contained the final result. At 45% counted, the central value was within 0.1 point of the result and, at 57%, it read 51.78%, the final figure. The range contained the result in every update of the night. At 8:34 pm, with 57.7% counted, it switched to the spread measured across cities, which is why it widens at that point of the chart.
5
The path to 100%
The dashed line shows how the count should evolve to the end, assuming the slowest states stay slow. It explains why the count can change leader in the middle of the night, since the Northeast, São Paulo and Rio usually report late. This time the order was unusual, with the North and Paraíba early and the South later, and the Lula and Flávio curves crossed more than once.
6
Where the votes came from
The diagram and the waterfalls estimate who voted for whom between rounds by ecological inference. Using the results of all 5,716 municipalities and abroad in both rounds, we fit the transition matrix with Goodman's method under constraints (each row sums to 100% and no flow is negative), weighted by the electorate, state by state; states with few municipalities are pooled with their region. The 90% margin comes from 100 resamples of municipalities and measures sampling variation, not aggregation bias. The flow from blank and spoiled votes to Lula is the component most exposed to that bias.
7
The municipal map
For each municipality, the transition matrix is fitted on its 80 nearest municipalities, with weights that fall with distance and rise with the electorate, and applied to that municipality's own first round. The origin of the votes thus varies across the territory, showing where Lula gained most from abstention and where most from blank and spoiled votes. The electorate's profile and first-round abstention by sex and age come from the TSE's open data. Added up, the municipal estimates do not match the national one, and the gap between the two is part of the method's uncertainty.
8
Box by box in the territories
In the favelas, quilombos and Indigenous lands tab, the runoff comes from the ballot-box reports published by the TSE, read one by one. Each section is linked to a territory through its polling place, when it lies inside the polygon or within 50 metres, with the option of widening to 150 metres (favelas) or 300 metres (quilombos and Indigenous lands). Territories are those of the IBGE 2022 Census and, in the city of Rio, the city's 2022 favela boundaries from the Instituto Pereira Passos. A box shows who votes at that place, which is not exactly who lives in the territory. Open the tab.
URNA A URNA
Favelas, quilombos e terras indígenas
Como votaram, no 1º e no 2º turno, as urnas instaladas nas favelas, nos quilombos e nas terras indígenas do Brasil. Os boletins de cada urna, publicados pelo TSE, foram cruzados com os territórios do Censo 2022 do IBGE e, na cidade do Rio de Janeiro, com os limites de favelas da Prefeitura. Filtre por uma favela, um complexo, um bairro, uma cidade, um estado ou o país inteiro.
…
Não encontrou uma favela? Ela pode não ter urna dentro ou perto dela. Veja abaixo como as urnas são ligadas aos territórios.
Como as urnas são ligadas aos territórios, e por que algumas favelas não aparecem
Não existe resultado eleitoral por favela, quilombo ou terra indígena. O que existe é o resultado de cada urna (seção eleitoral) e o endereço do local de votação, georreferenciado pelo TSE. Uma urna é atribuída a um território quando o local de votação fica dentro do contorno dele ou a poucos metros. O padrão desta página é de até 50 metros; o filtro permite ampliar para 150 metros (favelas) ou 300 metros (quilombos e terras indígenas). Quando uma urna fica perto de mais de um território, vale o mais próximo.
Por isso só aparecem os territórios que têm uma urna dentro ou bem perto. Muitas favelas não têm local de votação próprio: seus moradores votam em escolas do entorno, que também recebem eleitores de outros bairros. É o caso do Morro do Dendê, na Ilha do Governador, onde vivem cerca de 9 mil pessoas: os locais de votação mais próximos ficam a 165 metros, no Tauá, e a 189 metros, no Cocotá, fora do limite, e por isso ele não aparece.
Territórios
No mapa oficial
Com urna a até 50 m
Com urna a até 150 m (300 m)
Favelas e comunidades urbanas (IBGE, Censo 2022), fora da cidade do Rio
11.535
2.197
3.840
Favelas da cidade do Rio (Instituto Pereira Passos, 2022)
A urna mostra quem vota naquele local, o que não coincide exatamente com quem mora no território. Quanto maior a distância, mais eleitores do entorno entram na conta. A escolaridade dos eleitores de cada seção, publicada pelo TSE, mostra isso na cidade do Rio: nas urnas dentro das favelas, 4,4% dos eleitores têm ensino superior; a até 50 metros, 8,0%; entre 50 e 150 metros, 10,0%; entre 300 e 600 metros, 21,8%; e a mais de 1 quilômetro, 40,5%. O padrão de 50 metros privilegia a precisão sobre a abrangência.
O 2º turno de cada urna vem do boletim de urna publicado pelo TSE, lido um a um, e o 1º turno, dos dados abertos de votação por seção. São resultados contados, não estimativas. A origem dos votos (de onde vieram os votos novos de Lula e de Flávio) é estimada por inferência ecológica e aparece com essa indicação. Seções agregadas a outras ou sem boletim publicado (1,5% do total) ficam de fora.
Lula no 1º e no 2º turno
Votos de Lula em proporção dos votos dados a Lula ou a Flávio, nas urnas do recorte, no restante dos mesmos municípios e no Brasil. A marca preta indica o 1º turno.
De onde vieram os votos nestas urnas
Quem votou em quem, do 1º para o 2º turno, nas urnas do recorte. Passe o mouse nas faixas para ver quantos eleitores fizeram cada caminho. O diagrama e as cascatas acompanham os filtros do alto.
Para cada candidato: os votos do 1º turno, o que ele perdeu, o que ganhou e de quem, até chegar ao total do 2º turno.
Lula
Flávio
Mapa
Cada ponto é um território (no país e nos estados) ou uma urna (dentro de uma cidade), com tamanho proporcional ao eleitorado. Na cidade do Rio, os contornos são os das favelas da Prefeitura. Passe o mouse para ver os números e clique para filtrar.
Territórios do recorte
Clique no título de uma coluna para ordenar e numa linha para filtrar o território.
Como foi feito
Votos urna a urna
O 2º turno vem dos boletins de urna publicados pelo TSE no arquivo-urna da eleição (pleito 3221), lidos um a um; o 1º turno, dos dados abertos de votação por seção do TSE. A comparação é feita seção a seção.
Que urnas pertencem a cada território
Cada seção eleitoral tem o local de votação georreferenciado pelo TSE. A seção é atribuída ao território quando o local fica dentro do polígono ou a até 50 metros dele; o filtro permite ampliar para 150 metros (favelas) ou 300 metros (quilombos e terras indígenas), porque muitos moradores votam na escola da borda, ao custo de misturar mais eleitores do entorno. Nas seções da cidade do Rio, a escolaridade mostra a diferença: 8% dos eleitores têm ensino superior nas urnas a até 50 m das favelas, 10% entre 50 e 150 m e 22% entre 300 e 600 m. Favelas, territórios quilombolas oficialmente delimitados e terras indígenas vêm do Censo 2022 do IBGE; na cidade do Rio, as favelas são as do limite de 2022 do Instituto Pereira Passos (SABREN).
De onde vieram os votos
A transição é estimada por inferência ecológica: para cada tipo de território, em cada estado com urnas suficientes, ajusta-se a matriz de transição pelo método de Goodman com restrições; para o recorte escolhido, a matriz é ajustada aos totais do próprio recorte nos dois turnos (ajuste proporcional iterativo). É comportamento médio de grupos de urnas, não voto de eleitor.
Cuidados de leitura
A urna mostra quem vota naquele local, o que não coincide exatamente com quem mora no território. Nos quilombos e nas terras indígenas, muitos eleitores votam na sede do município. Seções agregadas ou sem boletim publicado ficam de fora.
BRASILEIROS QUE VOTAM FORA DO PAÍS
Voto no exterior
Quantos brasileiros inscritos para votar no exterior foram às urnas, quantos se abstiveram e como votaram, no 1º e no 2º turno, por continente, país e cidade de votação. No exterior, vota-se apenas para presidente.
Como o voto mudou do 1º para o 2º turno
Balanço de votos entre os turnos e a estimativa de onde vieram os votos novos.
Lula no 1º e no 2º turno, por país
O ponto cinza é o 1º turno e o vermelho, o 2º.
Comparecimento por país
Proporção dos inscritos que votaram em cada turno.
Mapa
Cada círculo é um país.
Abstenção no 1º turno por sexo e idade
Proporção dos inscritos que não votaram no 1º turno.